Traq
Self-hosted fitness analytics for Garmin activities: routes, elevation and, above all, the trends over time that other platforms keep behind a paywall.
The problem
Strava and Garmin Connect are good at listing activities. The analysis that shows whether you are actually getting better, the trends across weeks and months, is mostly reserved for paid plans. I wanted that view of my own data, on my own server.
What it does
Traq loads the .fit files that Garmin devices record and turns them into something you can explore:
- Routes: GPS tracks plotted over OpenStreetMap maps.
- Terrain: elevation and gradient profiles for each activity.
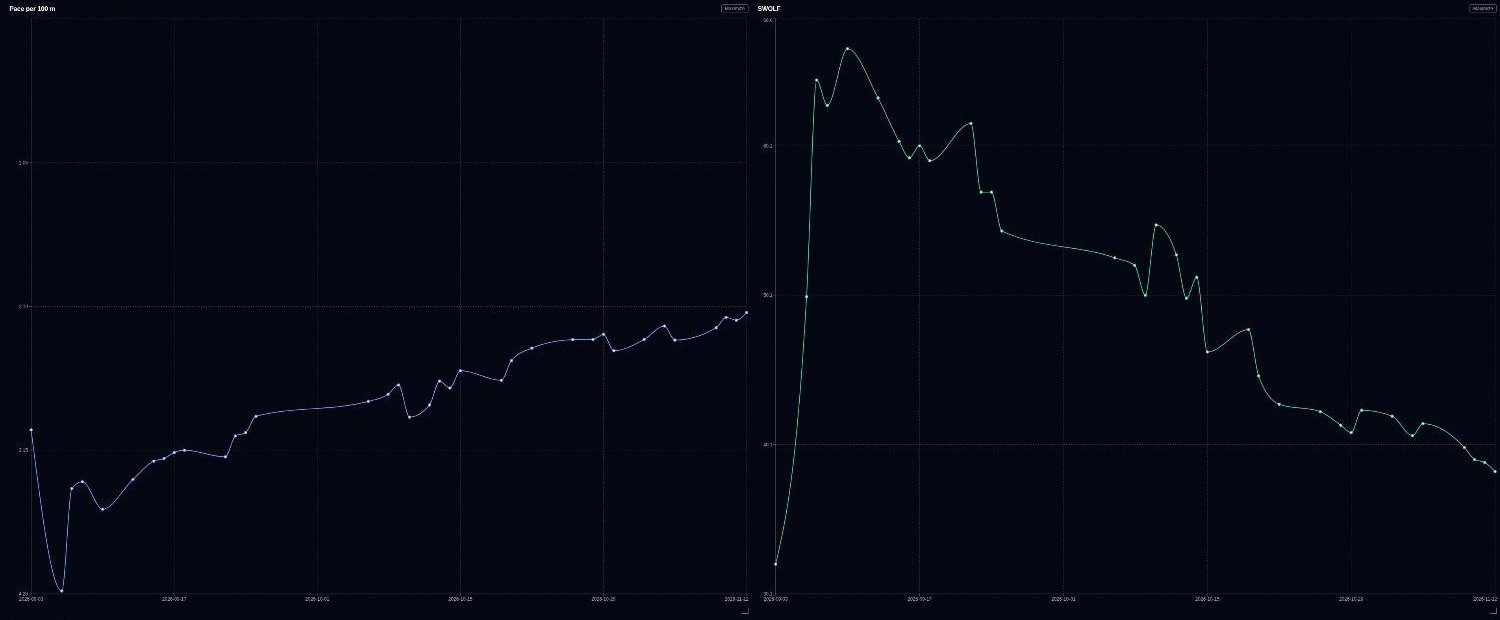
- Trends: performance indicators tracked over time, so runs, rides, swims and hikes can be compared across many sessions instead of one at a time.
How it is built
A Python (FastAPI) backend parses the activity files and serves a versioned REST API documented with OpenAPI. Geographic data lives in PostgreSQL with the PostGIS extension. The web front end is Next.js with TypeScript, using Leaflet and MapLibre for maps and Recharts for charts. There is also a native Android app written in Kotlin. The whole stack runs from Docker Compose, so it can be self-hosted.
It was built from a written product requirements document and an architecture document, with tests for every service, endpoint and component: pytest for the backend, Jest and Playwright for the front end, and JVM tests for the Android app.
Status
A personal project that I use myself. The source code is private.